Strategy / E-Commerce/ Supply Chain
The $100,000 China Order Has Changed
FX, freight, CAC and the new economics of e-commerce in 2026.
Why the next generation of e-commerce winners will think less like advertisers and more like supply-chain operators, capital allocators and brands.

ContentsShowHide
- 01The equation is changing
- 02The currency shift
- 03Freight changes the maths
- 04Sea, air and road
- 05The real transit map
- 06Freight as a weapon
- 07Margin is not profit
- 08The working-capital trap
- 09The consumer side
- 10Private label vs volume
- 11Sourcing as a portfolio
- 12Landed cost and packaging
- 13Brand as a CAC hedge
- 14Pricing, bundles, discounts
- 15One operating system
- 16SKU and country economics
- 17The infrastructure decade
Executive summary
The future competitive advantage in e-commerce is no longer products or advertising alone. It is infrastructure.
- 01A stronger yuan means the same $100,000 buys about 6.1% fewer yuan than a year ago, before any supplier reprices.
- 02Ocean freight from East Asia to the Mediterranean has moved from roughly $3,033 to the high-$4,000 range per 40-foot container.
- 03A representative procurement cycle moves from about $103,000 to more than $111,000 before customs, warehousing or advertising.
- 04Lower percentage margin does not mean lower profit, but it converts a P&L question into a working-capital question.
- 05Consumers are trading down and deal-seeking at the same time supplier and acquisition costs rise, squeezing both ends.
- 06Operators who negotiate freight, engineer packaging, diversify sourcing and build owned demand can widen the gap while the market repriced.
6.1%
Fewer yuan per dollar
August 2025 vs August 2026 Federal Reserve averages [1]
$6,481
Added cost on an unchanged RMB basket
Before freight, customs or marketing
~8.0%
Combined FX and freight increase
Single 40-foot container scenario
$45,660
Extra cash to hold contribution flat
Advertising plus inventory, illustrative model
00/The thesis
The e-commerce equation is changing
For years, a large part of e-commerce was built around a fairly straightforward equation: find a product in China, negotiate a good price, import it, add a healthy markup, run Meta or Google ads, and scale whatever converts.
It was never quite that simple operationally, but economically, many businesses could survive while being inefficient because there was enough margin inside the system.
In 2026, I think that cushion is becoming thinner. And the mistake would be to conclude that this means e-commerce is becoming less attractive. I think the opposite may happen.
E-commerce is becoming more difficult, and difficulty creates separation between operators who actually understand their numbers and those who only understand advertising dashboards.
The changes are happening simultaneously. The Chinese yuan has strengthened against the U.S. dollar. Ocean freight remains volatile. Air cargo is expensive enough that it cannot be treated casually. Consumers are more price-sensitive. Paid acquisition can become more difficult as more advertisers compete for the same attention. Inventory requires more working capital. Delivery, returns and failed orders can quietly consume margins.
At the same time, these same pressures can create opportunities for companies that plan logistics earlier, negotiate freight intelligently, build brands people actively search for, increase repeat purchasing, position inventory correctly and understand contribution margin at SKU level.
01/Currency
Start with China: $100,000 is no longer the same $100,000
The currency movement alone deserves attention. The Federal Reserve’s August 2025 average exchange rate was 7.1727 Chinese yuan per U.S. dollar. In August 2026, the average was 6.7361 yuan per dollar. [1]
Figure
What a stronger yuan does to the same dollar budget
| Measure | August 2025 | August 2026 |
|---|---|---|
| USD/CNY average | 7.1727 | 6.7361 |
| $100,000 purchasing power | 717,270 CNY | 673,610 CNY |
| Difference | 43,660 CNY less |
The same $100,000 therefore buys about 6.1% fewer yuan. There is another way to express this that is more relevant to an importer: if a Chinese factory charged 717,270 CNY for a basket of products in 2025, and the RMB price did not change at all, that same basket costs about $106,481 at the August 2026 exchange rate.
That is roughly $6,481 more before the factory changes its own price, and before freight, customs, warehousing or marketing enter the equation.

But it would be incorrect to say that every Chinese supplier automatically increased USD prices by the same percentage. Many export contracts are quoted in U.S. dollars, and suppliers can absorb part of the currency movement through margin, productivity, purchasing terms or pricing strategy. Exchange-rate pass-through is not mechanically 100% for every supplier or product. [2]
So I would not take the currency move and blindly increase every Chinese COGS assumption. I would use it as a negotiating and forecasting signal. If a supplier increases the dollar price, I want to understand whether the reason is RMB appreciation, raw materials, labour, packaging, energy, MOQ changes, or simply the supplier attempting to improve margin.
China is not disappearing
This is not an argument to “leave China.” China remains an extraordinary manufacturing ecosystem. Its advantage is not only labour cost; it is the depth of its supplier clusters, mould makers, packaging companies, component suppliers, textile mills, printers, tooling specialists, quality-control infrastructure, freight forwarding and port capacity. World Bank data continues to show the extraordinary scale of Chinese manufacturing. [3]
That is why “China versus Vietnam” is often the wrong conversation. The better conversation is: which part of my supply chain should stay in China, and which part should be diversified? Diversification is not abandonment. It is risk management.
02/Freight
Add freight, and the economics change again
Currency is only the first variable. The second is freight. Freightos reported a China/East Asia-to-Mediterranean benchmark of about $3,033 per 40-foot equivalent container around September 2025; by 2026, the benchmark had moved materially higher, around the high-$4,000 range at the time of this analysis. [4]
The important qualification is that this is a regional benchmark, not a guaranteed Shanghai-to-Beirut quotation. Actual Beirut freight depends on origin port, carrier, sailing, transshipment, container type, cargo, contract relationship, security surcharges, destination charges and timing.
Still, combining the FX change with a representative Mediterranean freight benchmark makes the economic direction clear.
Figure
The same procurement cycle, one year apart
| Scenario | 2025 | 2026 |
|---|---|---|
| Same RMB merchandise basket | $100,000 | $106,481 |
| Illustrative 40ft freight benchmark | $3,033 | $4,800 |
| Combined | $103,033 | $111,281 |
| Approx. increase | ~8.0% |

The same basic procurement cycle moves from roughly $103,000 to more than $111,000 before customs, terminal charges, warehousing, local transport, fulfilment, returns or advertising.
Product density also matters. A high-value electronic accessory and a bulky low-value household product may sell for the same retail price while having completely different logistics economics. This is why I do not like e-commerce discussions that talk about “margin” without discussing cube, weight and container utilisation.
Figure
Container count multiplies the exposure
| Containers for the same basket | Approx. 2025 total | Approx. 2026 total | Increase |
|---|---|---|---|
| 1 FEU | $103,033 | $111,281 | ~8.0% |
| 2 FEU | $106,066 | $116,081 | ~9.4% |
| 4 FEU | $112,132 | $125,681 | ~12.1% |
03/Transport strategy
Sea, air and road should have different jobs
One of the most important e-commerce logistics decisions is not simply which freight company gives the lowest quote. It is deciding what each transportation mode is supposed to accomplish.
- Sea freight is primarily a cost-efficiency and bulk-replenishment tool.
- Air freight is primarily a speed, launch and stockout-risk tool.
- Road transport handles first and last legs and can also form part of alternative regional routings.
- Express courier is an urgency and convenience product, not a default procurement strategy.
The mistake is evaluating all of them only by freight cost. Sometimes paying more for transportation creates more profit.
For stable demand and enough volume, FCL sea freight should usually form the foundation. For smaller volumes, LCL may make sense, but consolidation, handling and destination fees need to be checked carefully. For samples, launch quantities or urgent replenishment, air can make sense. Current air-cargo benchmarks continue to show large route-by-route cost differences, reinforcing why air should be managed intentionally rather than reactively. [5]
The right model is route optionality. If direct capacity becomes difficult, the business should understand alternatives: another Chinese origin port, a different transshipment service, or in some cases a China-to-Turkey movement followed by onward transport. The objective is not to find one perfect route. It is to avoid having only one route.
04/Visibility
The China-to-Lebanon journey is not simply factory to Beirut
A proper supply-chain model should follow every stage, from production to the customer’s door.
01Factory production and quality control
Inspection before goods leave the plant, not after they arrive at the port.
02Inland trucking and consolidation
Multiple suppliers combined so containers travel full rather than half-empty.
03Export documentation and port gate-in
Documentary readiness determines whether the booked sailing is actually caught.
04Loading and vessel departure
The booking is not the sailing. Rolled cargo is a real and recurring risk.
05Transshipment
Often the least visible and most delay-prone stage of the whole journey.
06Mediterranean passage and arrival
Published schedules are indicative; real transit varies by service.
07Discharge, customs and release
Port dwell and clearance can add more time than the sea leg's variance.
08Trucking, receiving and fulfilment
Goods are not sellable until they are received, counted and live on the store.
A serious e-commerce operator should be able to start with a container number or bill of lading and understand where the merchandise is, which vessel carries it, whether it reached transshipment, when it is expected to discharge, whether customs documents are ready and when the warehouse should expect it.
Forwarders are valuable, but the importer should still understand the operation. Published carrier schedules show that port-to-port Asia-to-Beirut movements can vary substantially by service, and real door-to-door lead time is longer after origin handling, customs, port dwell and final delivery. [6]
Reorder points should never be calculated using the most optimistic transit time.
They should use the real replenishment lead time plus safety stock appropriate to demand variability.
05/Procurement
Buying freight differently can become a competitive weapon
Imagine two e-commerce companies importing essentially the same category. Company A buys every container on the spot market. Company B knows it will move a predictable baseline of containers during the year and negotiates committed capacity in advance.
If spot rates spike, Company A experiences the full movement. Company B can have a much more predictable base cost. But annual freight does not become literally fixed. Carrier contracts may lock base rates or allocation while still allowing fuel, security, emergency, congestion, peak-season and other surcharges. Minimum-volume commitments can also create dead-freight exposure if the importer fails to use the capacity.
The objective is therefore not “fix freight forever.” It is “reduce volatility on the portion of demand I can actually forecast.”
Figure
Illustrative contract advantage over a year
| Line item | Value |
|---|---|
| Spot cost per FEU | $4,800 |
| Negotiated effective cost per FEU | $3,900 |
| Saving per container | $900 |
| Saving across 24 containers | $21,600 |
That $21,600 is not merely a logistics saving. It can finance inventory, creatives, paid media, salaries, a cash buffer or more competitive pricing. This is why procurement and marketing cannot be separated: a logistics negotiation can effectively create marketing budget.
There is also downside risk. If you contract at $3,900 and spot freight collapses to $2,500, the spot buyer temporarily wins. If you commit volume you do not use, dead freight can destroy the benefit. My preferred approach is hybrid: contract the predictable baseline and keep flexibility around uncertain volume.
Rising freight can actually improve your competitive position
Higher freight does not hurt every competitor equally. Suppose the entire category experiences a landed-cost increase. Most competitors have no freight contract, poor container utilisation and weak purchasing terms, so their costs rise sharply and the market eventually reprices.
If your own cost rises less because you negotiated freight earlier, filled containers more efficiently or secured better supplier terms, you can reprice alongside the market while keeping more of the increase as contribution.
06/Financial architecture
Lower margin does not necessarily mean lower profit
This is one of the most important financial points in the entire discussion. Margin and profit are not interchangeable. A company can operate at a lower percentage margin and still make substantially more absolute profit.
We need to separate gross margin, contribution margin and net profit. Gross margin is what remains after product and landed COGS. Contribution margin goes further and deducts variable costs such as fulfilment, payment fees, returns and customer acquisition. Net profit then accounts for fixed operating expenses as well.
Figure
Simplified unit economics, old model vs new model
| Simplified unit economics | Old model | New model |
|---|---|---|
| Selling price | $30.00 | $30.00 |
| Landed product cost | $10.00 | $10.80 |
| CAC | $8.00 | $10.00 |
| Contribution per order | $12.00 | $9.20 |
Contribution per order has fallen by about 23%. That sounds terrible. But volume changes the answer.
Figure
Absolute contribution under three volume scenarios
| Volume scenario | Contribution |
|---|---|
| 5,000 orders x $12 | $60,000 |
| 6,522 orders x $9.20 | ~$60,000 |
| 8,000 orders x $9.20 | $73,600 |
So margin compression does not automatically mean the company becomes less profitable. But it creates another problem: where does the money come from to finance the extra inventory and acquisition needed to generate the additional orders?
07/Cash
Margin compression becomes a working-capital problem
Using the same example, the original 5,000 orders required $40,000 of advertising at $8 CAC and approximately $50,000 of inventory at $10 landed cost. To generate roughly the same contribution under the new economics, the business needs about 6,522 orders.
Figure
Cash required to hold contribution flat
| Cash requirement | Old | To preserve similar contribution |
|---|---|---|
| Advertising spend | $40,000 | ~$65,220 |
| Inventory cost | $50,000 | ~$70,440 |
| Incremental cash required | ~$45,660 more |

This is why growth can kill a profitable business. The P&L says the company is making money while the bank account says something very different.
E-commerce growth consumes cash because advertising, supplier deposits and freight can all be paid before the complete economic cycle finishes. The better question is not simply “can we scale this?” It is “can we finance the cash-conversion cycle required to scale this?”
- Increase inventory turns.
- Negotiate supplier payment terms and deposits instead of full prepayment where feasible.
- Reduce unnecessary SKUs and liquidate dead stock earlier.
- Improve forecasting and reorder discipline.
- Negotiate freight credit or working-capital facilities where appropriate.
- Shorten fulfilment and settlement cycles.
- Increase repeat purchasing so every incremental order does not require full reacquisition cost.
The money still has to come from somewhere
Aggressive e-commerce growth eventually becomes a finance problem. Inventory is purchased before it is sold. Advertising is paid before every customer has settled. Freight and supplier deposits can be paid weeks before revenue is received. Returns and processor settlements create further timing gaps.
The company therefore needs to understand not only annual profitability but the maximum cash requirement during the operating cycle. Sometimes the best growth strategy is not increasing revenue; it is shortening the cash cycle: turn inventory faster, negotiate better supplier terms, reduce slow-moving SKUs, use sea freight for planned replenishment and reserve air for high-return urgency, keep profitable inventory moving, and treat every extra day of idle inventory as a financial cost.
08/Demand
Consumers are changing at the same time
The supply side is only half the problem. When household budgets tighten, consumers do not simply stop buying. They become more selective. They postpone certain products, trade down in some categories, search harder for promotions, reduce quantities and compare alternatives more aggressively.
McKinsey’s global consumer research has found persistent concern about rising prices, widespread trading down and heavy deal-seeking across surveyed markets. [7]
This matters because the e-commerce business can be squeezed from both directions: supplier costs rise, freight moves and CAC can rise, while the consumer simultaneously becomes more resistant to price increases.
The ability to pass cost increases through to the customer depends on category, brand, competition, trust, urgency and differentiation. Two companies importing the same underlying product can therefore have very different economics.
Trust becomes more valuable as consumers become more selective
When consumers have less room for financial error, trust matters more. They want to know whether the product will arrive, whether the website is legitimate, whether returns are real, whether someone will answer WhatsApp, whether reviews are genuine and whether delivery will happen when promised.
A company that consistently delivers what it promises can eventually charge more than a random seller offering the same underlying item. That premium is not simply “branding.” It is a trust premium, and a trust premium is another way to defend margin. This is the same logic behind why most regional stores fail to convert.
09/Model choice
Private label versus general-product e-commerce
Private label theoretically offers more pricing power because you control packaging, positioning, product improvements, story, creative direction, bundles, retention and customer data. Over time, you may create demand for the brand rather than merely demand for the underlying product.
But private label also introduces MOQ, packaging investment, quality-control requirements, inventory concentration, longer lead times and the risk of entering a category that becomes saturated. A logo alone does not create pricing power. The brand must create preference.
The general-product or volume model faces the opposite situation. Differentiation is lower and price comparisons are easier, so competitive advantage must come from procurement, freight, availability, merchandising, conversion, media efficiency, store trust, bundles or scale.
10/Sourcing
China should remain core, but sourcing should become a portfolio

China should remain part of the conversation, but it should not always be the only conversation. The correct sourcing strategy is category-specific, not ideological.
Vietnam is increasingly important in apparel, footwear, furniture, wood products, electronics and other export manufacturing categories. However, Vietnam is not independent from Chinese upstream inputs; China remains a major source of intermediate goods for Vietnamese manufacturing. [8] So moving final assembly does not necessarily eliminate China exposure.
India deserves more attention as well, particularly in textiles, apparel, leather, engineering products, selected electronics and other manufacturing categories. The currency direction has also differed from China: the dollar bought materially more Indian rupees in August 2026 than in August 2025, whereas it bought fewer Chinese yuan. [1] That does not mean Indian products automatically became cheaper, because local inflation, wages and supplier repricing matter, but it highlights why currency diversification can be strategically useful.
Turkey offers a different advantage: proximity. In some categories it may not beat China on factory price, but it can offer shorter replenishment cycles, smaller inventory commitments, closer quality-control access and lower forecast risk for Lebanon, MENA and Europe. [9]
A higher factory price can still produce a lower total economic cost when lead time, inventory risk, stockouts and financing are included.
11/Cost engineering
Landed cost matters more than factory price
Whenever someone tells me, “I found this for $8 in China,” my immediate reaction is: that is not the cost. The $8 is only the first number in the equation.
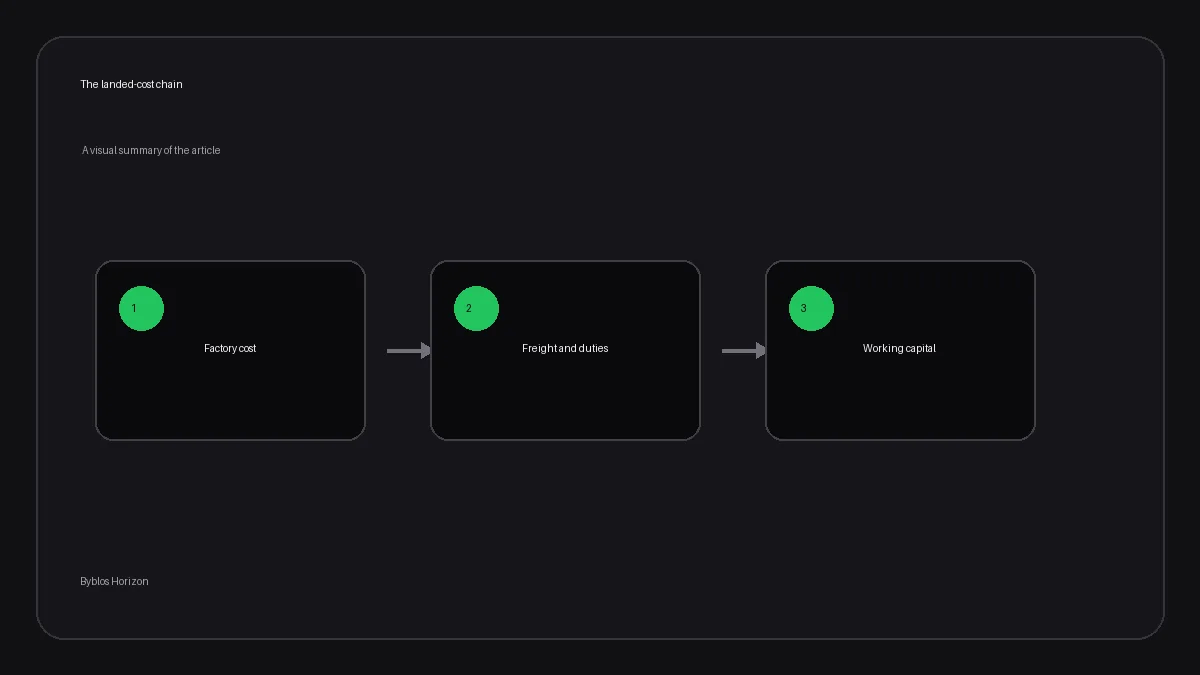
A proper landed-cost model includes factory price, packaging, inland origin transport, export handling, freight, insurance, customs and duties, terminal charges, broker fees, local transport, warehouse receiving and a realistic allowance for damage or defects.
Then profitability needs to go further: net selling price minus landed cost, payment fees, fulfilment, last-mile delivery, expected returns or refusals, discounts and CAC equals contribution margin.
The best freight strategy starts before the freight quote
Transportation economics begin at product selection and packaging design. Packaging dimensions matter. Carton efficiency matters. Weight matters. Shipping air inside oversized packaging matters. How well cartons cube into a container matters.
A packaging redesign can sometimes create a larger saving than negotiating another 2% from the factory. Supplier consolidation can also matter: instead of twenty suppliers shipping half-empty consignments, an origin warehouse can combine stock and improve container utilisation.
Good planning also changes the role of air. Instead of using air because inventory planning failed, air becomes an intentional tool for launches, fast-moving replenishment or profitable stockout prevention.
Inventory should be layered, not blindly concentrated

For some cross-border businesses, it can make sense to place the majority of inventory in the main sales market while keeping a smaller portion at an origin or China fulfilment hub. One possible operating model is roughly 65 to 70% in the primary market and 30 to 35% retained at origin, but this is an example architecture rather than a universal rule.
The local inventory protects delivery speed. The origin inventory preserves flexibility: it can fulfil international orders, support tests in another market, reduce the risk of overstocking one country or be redirected toward whichever geography begins converting best.
For an operator testing Australia, GCC, Africa or another market, this can avoid immediately replicating inventory everywhere. The warehouse becomes part of the growth infrastructure. It is the same principle behind scaling Shopify stores internationally.
12/Acquisition
Brand is an acquisition-cost hedge
There is another way to fight margin compression: reduce dependency on constantly reacquiring every order through paid media.
Imagine two shops selling a similar product. The first receives meaningful traffic only when it pays Meta or Google. The second has customers searching its name directly, bookmarking the site, returning through WhatsApp, responding to email, finding category pages organically and recommending the store to others.
Those businesses can have completely different blended acquisition economics even when their platform CPMs look similar. This is why brand should increasingly be treated as an economic asset, not simply a creative asset.
If the business becomes the customer’s default place to search, it has reduced the number of times it needs to rent that customer’s attention.
Think in blended CAC, not only Meta CAC
Suppose paid acquisition costs $12 per new customer. If 100% of new orders depend on paid media, acquisition economics are highly exposed. If a meaningful share of orders comes from organic search, repeat customers, direct traffic, CRM, WhatsApp, email and referrals, blended acquisition cost can be materially stronger.
This creates room to bid more aggressively when paid traffic is strategically important. It also changes first-order ROAS logic: a business with strong repeat purchasing can sometimes tolerate lower first-order efficiency than a competitor that must reacquire every purchase.
But LTV cannot be a fantasy. Repeat rates need to be measured. WhatsApp, loyalty and CRM need incremental proof. Retention deserves the same analytical discipline as acquisition, which is why owned-channel flows belong in the economic model, not the content calendar.
Maximum CAC should be calculated before the campaign
Too many e-commerce businesses run campaigns first and decide afterward whether the result was profitable. I think the sequence should be reversed.
First calculate net selling price, landed product cost, expected payment cost, delivery, fulfilment, return/refusal reserve and the minimum contribution the business requires. What remains is the maximum sustainable acquisition cost.
13/Pricing
Discounts, bundles and the courage to reprice
Do not solve every cost increase with discounts
When consumers become price-sensitive, discounts can become more powerful, but they can also train the market to wait. Promotions are useful when they have a job: launch, bundle, inventory clearance, retention, acquisition testing or seasonality. Permanent discounting can destroy private-label pricing power.
The better objective is to increase perceived value rather than continuously lower price.
Bundles matter more when acquisition becomes expensive
If acquiring one customer costs $10, I would rather sell that customer $45 than $25 when the incremental COGS make sense. Bundles can increase AOV without proportionally increasing CAC and can also improve last-mile economics.
But bundles need commercial logic. The products should naturally belong together and ideally solve a larger problem. The goal is not a bigger cart for the sake of it; the goal is higher contribution per acquired customer.
A higher retail price is not automatically bad
Businesses often become emotionally resistant to price increases. But if the category’s landed cost has moved, refusing to reprice can be irrational. The question is elasticity.
If price increases 5% and conversion falls only 2%, the business may become more profitable. If conversion falls 20%, the increase may be a mistake. The responsible answer is to test.
Price elasticity should become part of performance marketing. New versus returning customers can behave differently. Bundles can absorb increases more elegantly. Premium shipping can create segmentation. Entry-level SKUs can protect accessibility.
14/Operating model
The strongest e-commerce model connects logistics with media buying
Imagine the media team sees a product producing excellent CAC and scales aggressively. Two weeks later, inventory runs out. The campaign pauses. Air freight becomes necessary. Costs rise. Then inventory arrives after demand cools, and the business becomes overstocked.
That is not a marketing problem. It is an operating-system problem.
The media team should know weeks of inventory. Logistics should know sales velocity. Procurement should know the advertising forecast. Finance should know the working-capital requirement. Management should know whether the next marginal order is still profitable. All of these functions are affecting the same commercial equation.
Scale on marginal CAC, not historical average CAC
Suppose the first 1,000 customers cost $6 each, the next 2,000 cost $8, and the next 5,000 cost $12. Saying “our average CAC is fine, so let’s scale” can be misleading. The next dollar of advertising matters more than the historical average.
Figure
Average CAC hides the cost of the next cohort
| Cohort | Customers | CAC |
|---|---|---|
| First cohort | 1,000 | $6 |
| Second cohort | 2,000 | $8 |
| Third cohort | 5,000 | $12 |
| Next cohort | 1,000 | $14 |
If the next 1,000 orders cost $14 to acquire and your maximum sustainable CAC is $11, scale is destroying value even while revenue increases. Profitable scale requires marginal economics.
Sometimes lower margins should make you spend more, not less
This is counterintuitive. If competitors react to lower margins by cutting advertising, auction pressure can ease. If your balance sheet is strong and contribution remains positive, that may be the moment to spend more.
The same can happen in procurement. Weaker competitors cannot finance larger purchase orders, so stronger operators may gain volume discounts, production capacity, freight terms or market share.
A difficult market can transfer share from undercapitalised operators to disciplined ones. The answer to margin compression is therefore not automatically “cut everything.” It is “understand where the next dollar generates the highest return.”
15/Granularity
Incoterms, SKUs and country-level economics
There is an Incoterm problem hiding inside many supplier quotes
Importers often compare quotations that do not include the same things. An EXW price is not comparable with FOB. FOB is not comparable with CIF. CIF is not comparable with a true door-to-door landed quote.
Two suppliers can appear $1 apart while the apparently cheaper supplier becomes more expensive after origin trucking, export handling and documentation. Quotations should therefore be normalised into the same landed-cost structure.
The commercial team should know what is included, what is excluded, who handles export customs, who books freight, who carries insurance, what destination charges remain, who handles clearance and at which point risk transfers.
Know profit by SKU, not only by company
Company-level profitability can hide bad products. One bestseller can subsidise ten weak SKUs, and rising logistics costs make this more dangerous.
Each product should have its own model: selling price, discount rate, COGS, cube, weight, freight allocation, duty, payment fee, fulfilment, delivery, return/refusal rate, CAC, repeat rate, contribution and inventory days.
Know economics by country as well
A market with cheap CPM is not necessarily attractive. A high conversion rate is not automatically attractive. The full system matters: payment acceptance, COD behaviour, delivery reliability, returns, customs, advertising cost, competition, AOV, trust, fulfilment and repeat potential.
A $5 CAC market can be worse than a $20 CAC market if customers spend less, refuse more deliveries or rarely reorder. International expansion should therefore be based on country-level contribution economics, not advertising statistics alone.
16/Conclusion
The final strategy is not cheaper sourcing. It is better economics

The businesses I think will win are not necessarily those that find the cheapest factory. They will understand the complete equation.
My view of e-commerce in 2026
I do not think e-commerce is becoming impossible. I think lazy e-commerce is becoming harder.
There was a period when an operator could find a decent product, put a large markup on it, launch ads and make money despite mediocre logistics and weak financial analysis. Those inefficiencies become much more dangerous when currencies move, shipping changes and customers become more selective.
But those pressures also create barriers to entry, and barriers to entry can be good for serious businesses.
If freight becomes more expensive, the company with better freight contracts gains an advantage. If CAC rises, the company with stronger organic demand gains an advantage. If consumers become cautious, the company they already trust gains an advantage. If inventory becomes expensive, the company with better forecasting gains an advantage. If supplier prices rise, the company with sourcing alternatives gains an advantage. If margins become thinner, the company that understands contribution and working capital gains an advantage.
The next competitive advantage is infrastructure: procurement infrastructure, logistics infrastructure, data infrastructure, brand infrastructure, CRM infrastructure and financial infrastructure.
The $100,000 order from China has changed. The businesses that survive will change with it. The businesses that become significantly larger will use the change against competitors who did not prepare for it.
The operator checklist
What the winners will actually do
- Know when sea freight is appropriate and when air freight protects more contribution than it costs.
- Negotiate predictable freight for baseline volume while retaining flexibility for unexpected demand.
- Track containers rather than outsourcing all visibility to a forwarder.
- Understand alternative routings before direct capacity becomes difficult.
- Diversify suppliers without pretending every country can replace China.
- Know the difference between factory price and landed cost.
- Know your maximum sustainable CAC before campaigns launch.
- Calculate profitability on delivered and paid orders, not website orders.
- Accept lower percentage margins when volume and absolute contribution justify it, but only if the working capital is financeable.
- Build organic search, direct traffic, CRM, email, WhatsApp, repeat purchasing and brand demand so every future sale does not require renting attention.
- Connect procurement, logistics, finance and marketing into the same operating system.
- Treat every extra day of idle inventory as a financial cost.
Frequently asked questions
The questions operators ask us
How did the USD to CNY exchange rate change between 2025 and 2026?
The Federal Reserve's August 2025 average was 7.1727 yuan per dollar. In August 2026 the average was 6.7361. The same $100,000 therefore buys about 6.1% fewer yuan, so an unchanged RMB basket of 717,270 CNY costs roughly $106,481 instead of $100,000.
Does a stronger yuan automatically raise my Chinese supplier prices?
No. Many export contracts are quoted in dollars and suppliers can absorb part of the currency movement through margin, productivity, purchasing terms or pricing strategy. Exchange-rate pass-through is not mechanically 100%. Treat the currency move as a negotiating and forecasting signal, not an automatic COGS increase.
How much has ocean freight from China to the Mediterranean increased?
Freightos reported a China and East Asia to Mediterranean benchmark of about $3,033 per 40-foot container around September 2025. By 2026 the benchmark had moved materially higher, into the high-$4,000 range. These are regional indicators, not guaranteed port-pair quotations.
Does a lower margin mean lower profit in e-commerce?
Not necessarily. Contribution per order can fall while absolute contribution rises if volume grows enough. The real constraint is working capital: more orders require more inventory and more advertising paid before revenue is collected, so the question is whether the cash-conversion cycle is financeable.
What is maximum sustainable CAC and how do I calculate it?
Start from net selling price, subtract landed product cost, payment costs, delivery and fulfilment, a return or refusal reserve, and the minimum contribution the business requires. What remains is the maximum sustainable acquisition cost. Calculate it before the campaign launches, not after.
Should e-commerce brands move sourcing out of China?
Diversification is risk management, not abandonment. China's supplier clusters, tooling, packaging and port capacity remain hard to replace. Vietnam, India and Turkey each solve different problems, and Vietnam still depends heavily on Chinese intermediate goods, so relocating final assembly does not eliminate China exposure.
Why is landed cost more important than factory price?
Factory price is only the first number. Landed cost includes packaging, inland origin transport, export handling, freight, insurance, customs and duties, terminal charges, broker fees, local transport, warehouse receiving and a realistic damage allowance. In COD markets, profitability should then be calculated on delivered and paid orders, not website orders.
Sources and research notes
- [1]Federal Reserve, Foreign Exchange Rates / G.5 and USD-CNY historical data https://www.federalreserve.gov/releases/G5/Current/
- [2]Research on exchange-rate pass-through and Chinese exporters https://www.sciencedirect.com/science/article/pii/S0165176525004331
- [3]World Bank manufacturing value-added data https://data.worldbank.org/indicator/NV.IND.MANF.CD
- [4]Freightos Baltic Index / China-East Asia to Mediterranean freight commentary and FBX13 https://www.freightos.com/
- [5]Xeneta air-cargo market updates https://www.xeneta.com/news
- [6]CMA CGM line-service schedules https://www.cma-cgm.com/ebusiness/schedules/line-services
- [7]McKinsey, State of Consumer and consumer-sentiment research https://www.mckinsey.com/industries/consumer-packaged-goods/our-insights/state-of-consumer-2025
- [8]World Bank / WITS Vietnam trade and intermediate-goods data https://wits.worldbank.org/CountryProfile/en/Country/VNM/
- [9]U.S. International Trade Administration, Turkiye advanced manufacturing https://www.trade.gov/country-commercial-guides/turkey-advanced-manufacturing
- [10]UNCTAD, Review of Maritime Transport 2025 https://unctad.org/publication/review-maritime-transport-2025
Methodological note. Freight benchmarks in this article are regional indicators, not guaranteed Shanghai-to-Beirut quotations. Actual landed costs should always be recalculated using live supplier prices, HS classification, Incoterms, origin and destination charges, carrier quotations, customs treatment and the importer's own freight agreements. Country diversification should likewise be evaluated supplier-by-supplier and category-by-category rather than assuming any market is universally cheaper than China.
Practical next steps
Use the operating model alongside these planning resources:
- calculate your real landed cost and profit.
- connect unit economics to store operations.
- set acquisition limits from contribution margin.
Sources
- Federal Reserve G.5 data supports the USD and CNY exchange-rate comparison. Federal Reserve foreign exchange rates.
- World Bank data provides country-level manufacturing value-added context. World Bank manufacturing data.
- The guide documents Turkey's advanced manufacturing base. US Trade Administration Turkey guide.
Related services
Related reading
We audit unit economics before we ever talk about ad spend
Landed cost, freight terms, COD exposure, AOV engineering, retention and maximum sustainable CAC, modelled before a single campaign launches.