MENA Market Insights
The Distribution Trap: Why More Retailers Do Not Always Mean Growth

Mohamad Haidar
Founder of Byblos Horizon
Published August 18, 2026 · 5 min read · Updated September 17, 2026
I discovered this the hard way.
At first, I believed that more wholesalers, more retailers and more products in the market automatically meant stronger distribution.
The logic seemed obvious: greater availability should create more sales, and more sales should create growth.
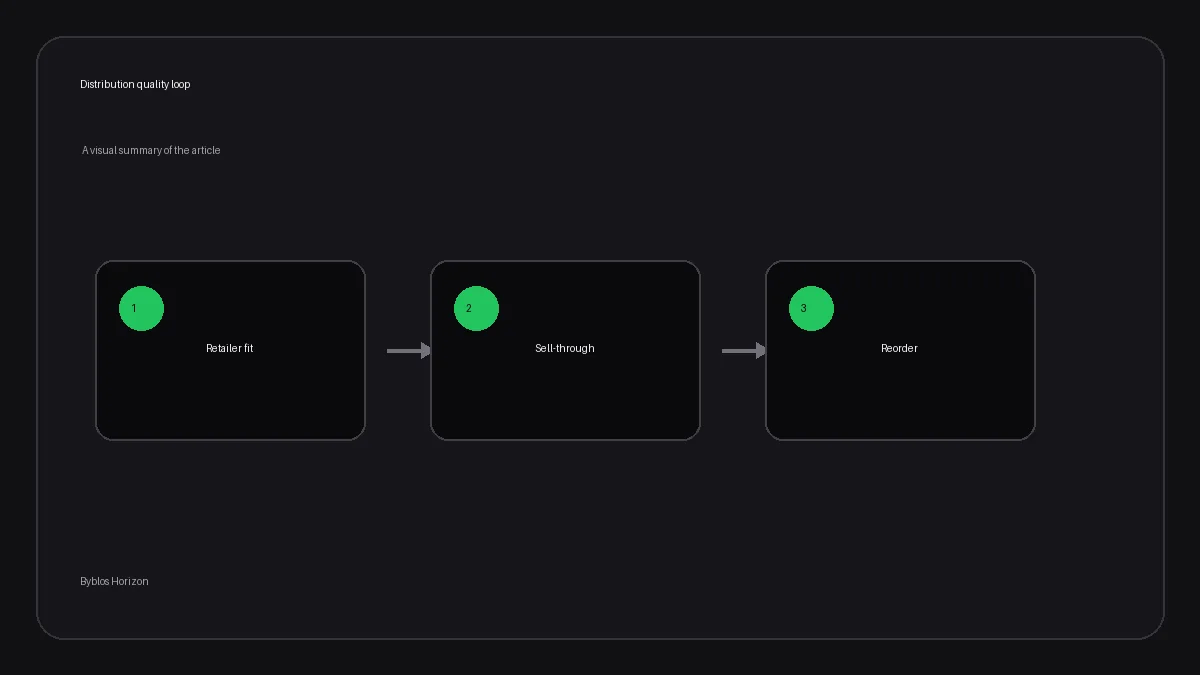
Then I found myself trapped in a loop.
Sell more units. Add another retailer. Offer better commercial terms. Accept a slightly lower margin. Extend the payment period. Push more inventory into the market. Repeat.
From the outside, the numbers looked positive. Sales were increasing and distribution was expanding.
But underneath those visible numbers, other variables were moving in the wrong direction.
Margins were tightening. Payments were taking longer. Prices were becoming inconsistent. Inventory was moving into stores without necessarily moving out to customers. Most importantly, control over the brand was weakening.
That experience taught me that distribution is not about how many doors you enter. It is about what each door contributes after every cost, risk and strategic consequence is considered.
What makes a distribution strategy profitable?
A profitable distribution strategy places a product in the right outlets, at the right margin, with healthy sell-through, reliable payment collection and consistent pricing.
Sales volume alone cannot tell you whether your distribution strategy is working.
You must measure:
- What you sold to the retailer
- What the retailer sold to customers
- How much cash you collected
- How quickly the inventory moved
- Whether the agreed price was protected
- Whether the retailer strengthened or weakened the brand
This is where I initially went wrong. I was measuring the transaction instead of measuring the complete distribution relationship.
The first mistake: confusing sell-in with sell-through
Sell-in is what a brand sells to a distributor or retailer.
Sell-through is what that distributor or retailer actually sells to the final customer.
The difference is critical.
A retailer ordering 10,000 units may appear more valuable than one ordering 7,000 units. But what if the first retailer sells only 55% of its inventory, repeatedly discounts the product and pays late?
Meanwhile, the second retailer sells 85%, protects the agreed price and pays almost entirely on time.
The bigger order may create excess stock, future returns, forced promotions and pressure on the next purchase. The smaller order may generate healthier and more repeatable demand.
Sell-through rate can be calculated as:
Sell-through rate = Units sold to customers ÷ Units received × 100
The measurement period must also be defined. A 70% sell-through rate over 30 days is very different from 70% over an entire year.
The equation I wish I had used from the beginning
I now evaluate the risk-adjusted economic contribution of a distribution partner using this simplified equation:
Expected channel contribution = Units shipped × Sell-through rate × Contribution margin per unit × Collection probability − Incremental channel costs
Contribution margin per unit should account for:
Selling price − Landed product cost − Discounts − Variable logistics − Commissions − Expected returns
Consider two wholesale partners:
| Variable | Partner A | Partner B |
|---|---|---|
| Units shipped | 10,000 | 7,000 |
| Sell-through rate | 55% | 85% |
| Contribution margin per unit | $1.50 | $2.00 |
| Collection probability | 95% | 99% |
| Incremental channel costs | $1,000 | $600 |
| Expected channel contribution | $6,837.50 | $11,181 |
Partner A orders more products, but Partner B produces approximately 64% more expected channel contribution under these assumptions.
That is the difference between measuring activity and measuring quality.
This equation is a decision-making framework, not a complete accounting model. Taxes, financing costs, bad-debt timing, fixed overhead and contractual returns may also need to be included.
If the distributor purchases the inventory outright, sell-through may not affect the value of the current invoice directly. However, it remains essential because it affects future orders, discount pressure, inventory returns and the long-term health of the relationship.
The same principle applies to e-commerce unit economics in Lebanon: revenue becomes meaningful only after the real cost structure is understood.
More stores do not necessarily mean better market coverage
Another lesson I learned was that the number of outlets can be misleading.
Numeric distribution measures the percentage of relevant stores carrying your product.
Weighted distribution considers the commercial importance of those stores based on the proportion of market or category sales they represent.
A brand may be available in 60% of stores but still be missing from the outlets responsible for most category sales. On paper, it has wide distribution. Commercially, it may still have weak access to actual demand.
One useful measurement is:
Distribution efficiency = Weighted distribution ÷ Numeric distribution
If numeric distribution is 60% and weighted distribution is 45%, distribution efficiency equals:
45% ÷ 60% = 0.75
This suggests the brand may not need more stores. It may need better stores.
NielsenIQ also uses the relationship between numeric and weighted distribution to evaluate the efficiency and quality of market coverage.
The variables hidden behind sales volume
I learned to evaluate every distributor or retailer across at least six dimensions:
- Profitability: Contribution remaining after discounts, logistics and returns.
- Sell-through: Whether products are reaching customers or simply another warehouse.
- Collection quality: How much is collected and how long collection takes.
- Price compliance: Whether the partner protects the agreed market price.
- Strategic fit: Whether the outlet reaches the right customer, location and market position.
- Data quality: Whether the partner provides credible stock, sales and return information.
These variables can be combined into a Distributor Quality Score:
DQS = 0.25P + 0.20S + 0.15C + 0.15PC + 0.15SF + 0.10D
Where:
- P = Profitability score
- S = Sell-through score
- C = Collection-quality score
- PC = Price-compliance score
- SF = Strategic-fit score
- D = Data-quality score
Each variable is scored from 0 to 100.
The weights should change depending on the business. A premium brand may give more weight to price compliance and customer experience. A fast-moving consumer product may prioritize inventory rotation, market coverage and collection.
No equation can predict everything. The purpose is to stop one large purchase order from hiding five weak variables.
When distribution begins damaging the brand
Poor distribution does not only reduce profit. It can damage brand equity.
When customers see the same product offered at conflicting prices, the lowest price becomes their new reference.
When retailers receive excessive inventory, discounting becomes the easiest way to recover cash. Other retailers then demand similar prices or better commercial terms.
This creates channel conflict: the behavior of one partner weakens the economics or motivation of another.
The problem becomes even more sensitive when a business operates both retail and wholesale channels.
If the objective is a one-time transaction, you may only care about moving the inventory.
But if you are building a long-term brand and a healthy distribution ecosystem, you must care about where the product is sold, how it is presented, how it is priced and what kind of experience surrounds it.
This reflects the same lesson I discussed in Virality Doesn’t Sell. Relevance Does.: bigger visible numbers can still produce weaker commercial outcomes.
What I would do differently today
Before approving or expanding any retail or wholesale relationship, I would ask:
- What is the expected contribution margin after all channel costs?
- What percentage of the inventory should sell within 30, 60 and 90 days?
- What is the probability and expected timing of collection?
- Will this partner maintain the agreed market price?
- Does the outlet reach customers we genuinely want?
- Will we receive reliable inventory and sales data?
- Could the agreement create conflict with existing partners?
- Who carries the risk of unsold inventory?
- Does this relationship strengthen the brand or only increase short-term volume?
These questions may slow down the first transaction, but they can protect the next hundred.
The lesson I learned the hard way
Distribution is not about placing a product everywhere.
It is about creating a system in which the manufacturer, distributor, retailer and final customer can all create value without destroying the economics of the next participant.
The biggest buyer is not always the best partner.
The highest sell-in month is not necessarily the healthiest month.
And revenue that damages margins, cash flow, pricing discipline or brand equity may not be growth at all.
I entered the distribution loop by looking at the most visible number: volume.
I began finding my way out when I started measuring the variables underneath it.
More distribution can create growth.
But only quality distribution can create a business that continues growing.
If your retail or wholesale operation looks strong on the surface but weak in the numbers underneath, Byblos Horizon can help you audit the economics and build a healthier growth strategy.
Frequently asked questions
What is a retail distribution strategy?
A retail distribution strategy determines where and how a product reaches customers. It includes channel selection, retailer quality, geographic coverage, pricing rules, margins, inventory movement, data sharing and customer experience.
How should distributor performance be evaluated?
Distributor performance should be evaluated using profitability, sell-through, payment collection, inventory rotation, price compliance, strategic market fit and reporting quality. Purchase volume should not be the only measure.
What is the difference between sell-in and sell-through?
Sell-in is the quantity sold by a brand to a distributor or retailer. Sell-through is the quantity the channel subsequently sells to final customers. High sell-in with weak sell-through can create excess inventory and future discount pressure.
Is wider distribution always better for a brand?
No. Wider distribution creates value only when the additional outlets reach commercially valuable customers, move inventory efficiently, pay reliably and protect the brand’s pricing and positioning.
What causes channel conflict?
Channel conflict occurs when the pricing, territory, promotions or selling behavior of one partner harms another sales channel. Common causes include uncontrolled discounting, overlapping territories, excessive inventory and inconsistent wholesale terms.
Practical next steps
Distribution decisions also need a demand and conversion plan:
- connect channel economics to a growth plan.
- support sell-through with measured demand.
- assess market expansion across MENA.
Sources
- Google documents how important customer actions can be measured as conversions. Google Analytics conversion documentation.
- Google documents the role of conversion measurement in campaign optimisation. Google Ads conversion guidance.